Audience building
Two channels from zero. One month of posting, 18.4M views, 62.7K followers between them.
- Category
- Distribution / independent experiments
- Tags
Overview
Two TikTok channels, both from zero. One about physics and space, one about stoicism and history.
Different skill from building, and the feedback shows up in hours instead of months. Something lands or it doesn't, and you find out immediately.
The channels
@the.feynman.space
- Topic
- Physics and space
- Posted
- 11 Mar to 30 Mar 2025
- Posts
- 10
- Views
- 9.1M
- Followers
- 21.5K
- Likes
- 1.4M
- Biggest post
- 4.7M (11 Mar)
@thestoicmindsetscroll
- Topic
- Stoicism and history
- Posted
- 4 Mar to 4 Apr 2025
- Posts
- 20
- Views
- 9.3M
- Followers
- 41.2K
- Likes
- 1.7M
- Biggest post
- 5.5M (17 Mar)
Followers, likes and view counts read off both public profiles on 21 September 2026. Post dates come from the video IDs. Per channel, not combined.
A month, and then it was done
- The Feynman Space
- The Stoic Scroll
Followers, roughly
- The Feynman Space
- The Stoic Scroll
The posts that did the work
17 Mar 2025
- Channel
- The Stoic Scroll
- Views
- 5.5M
11 Mar 2025
- Channel
- The Feynman Space
- Views
- 4.7M
11 Mar 2025
- Channel
- The Feynman Space
- Views
- 1.9M
30 Mar 2025
- Channel
- The Stoic Scroll
- Views
- 1.3M
24 Mar 2025
- Channel
- The Feynman Space
- Views
- 1.1M
Five of the thirty posts account for 15.3M of the 18.4M views.
Proof
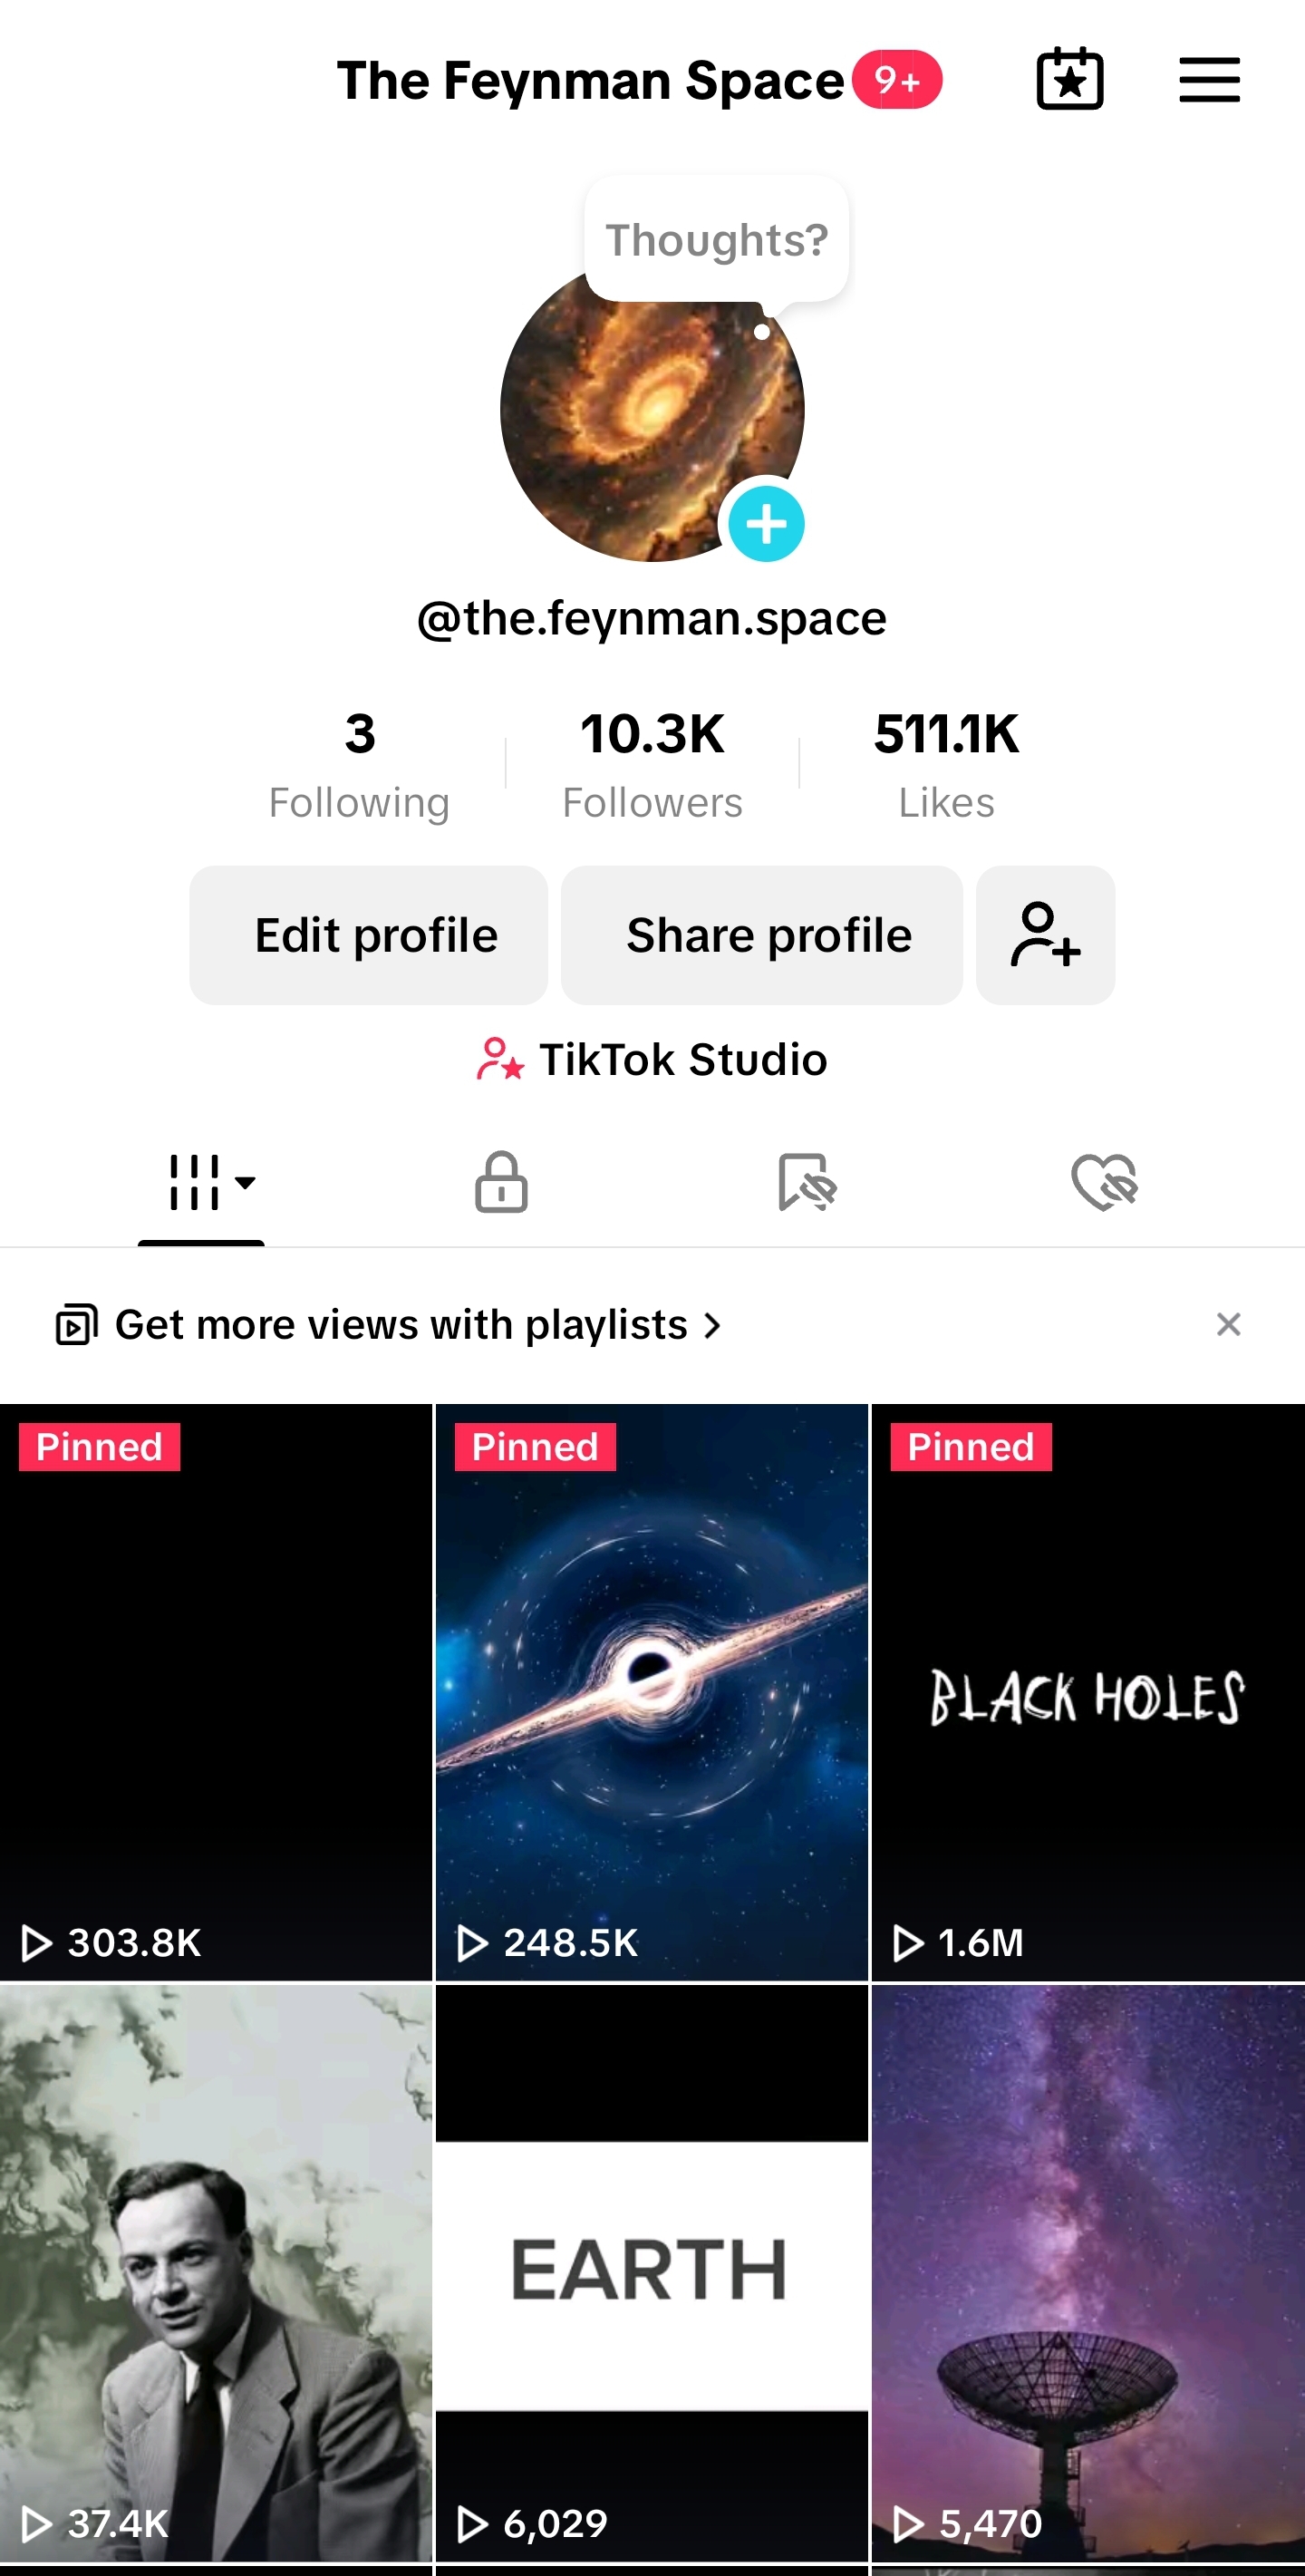 , opens full size in a new tab
The Feynman Space
14 Apr 2025: 10.3K followers, 511.1K likes. Today: 21.5K and 1.4M.
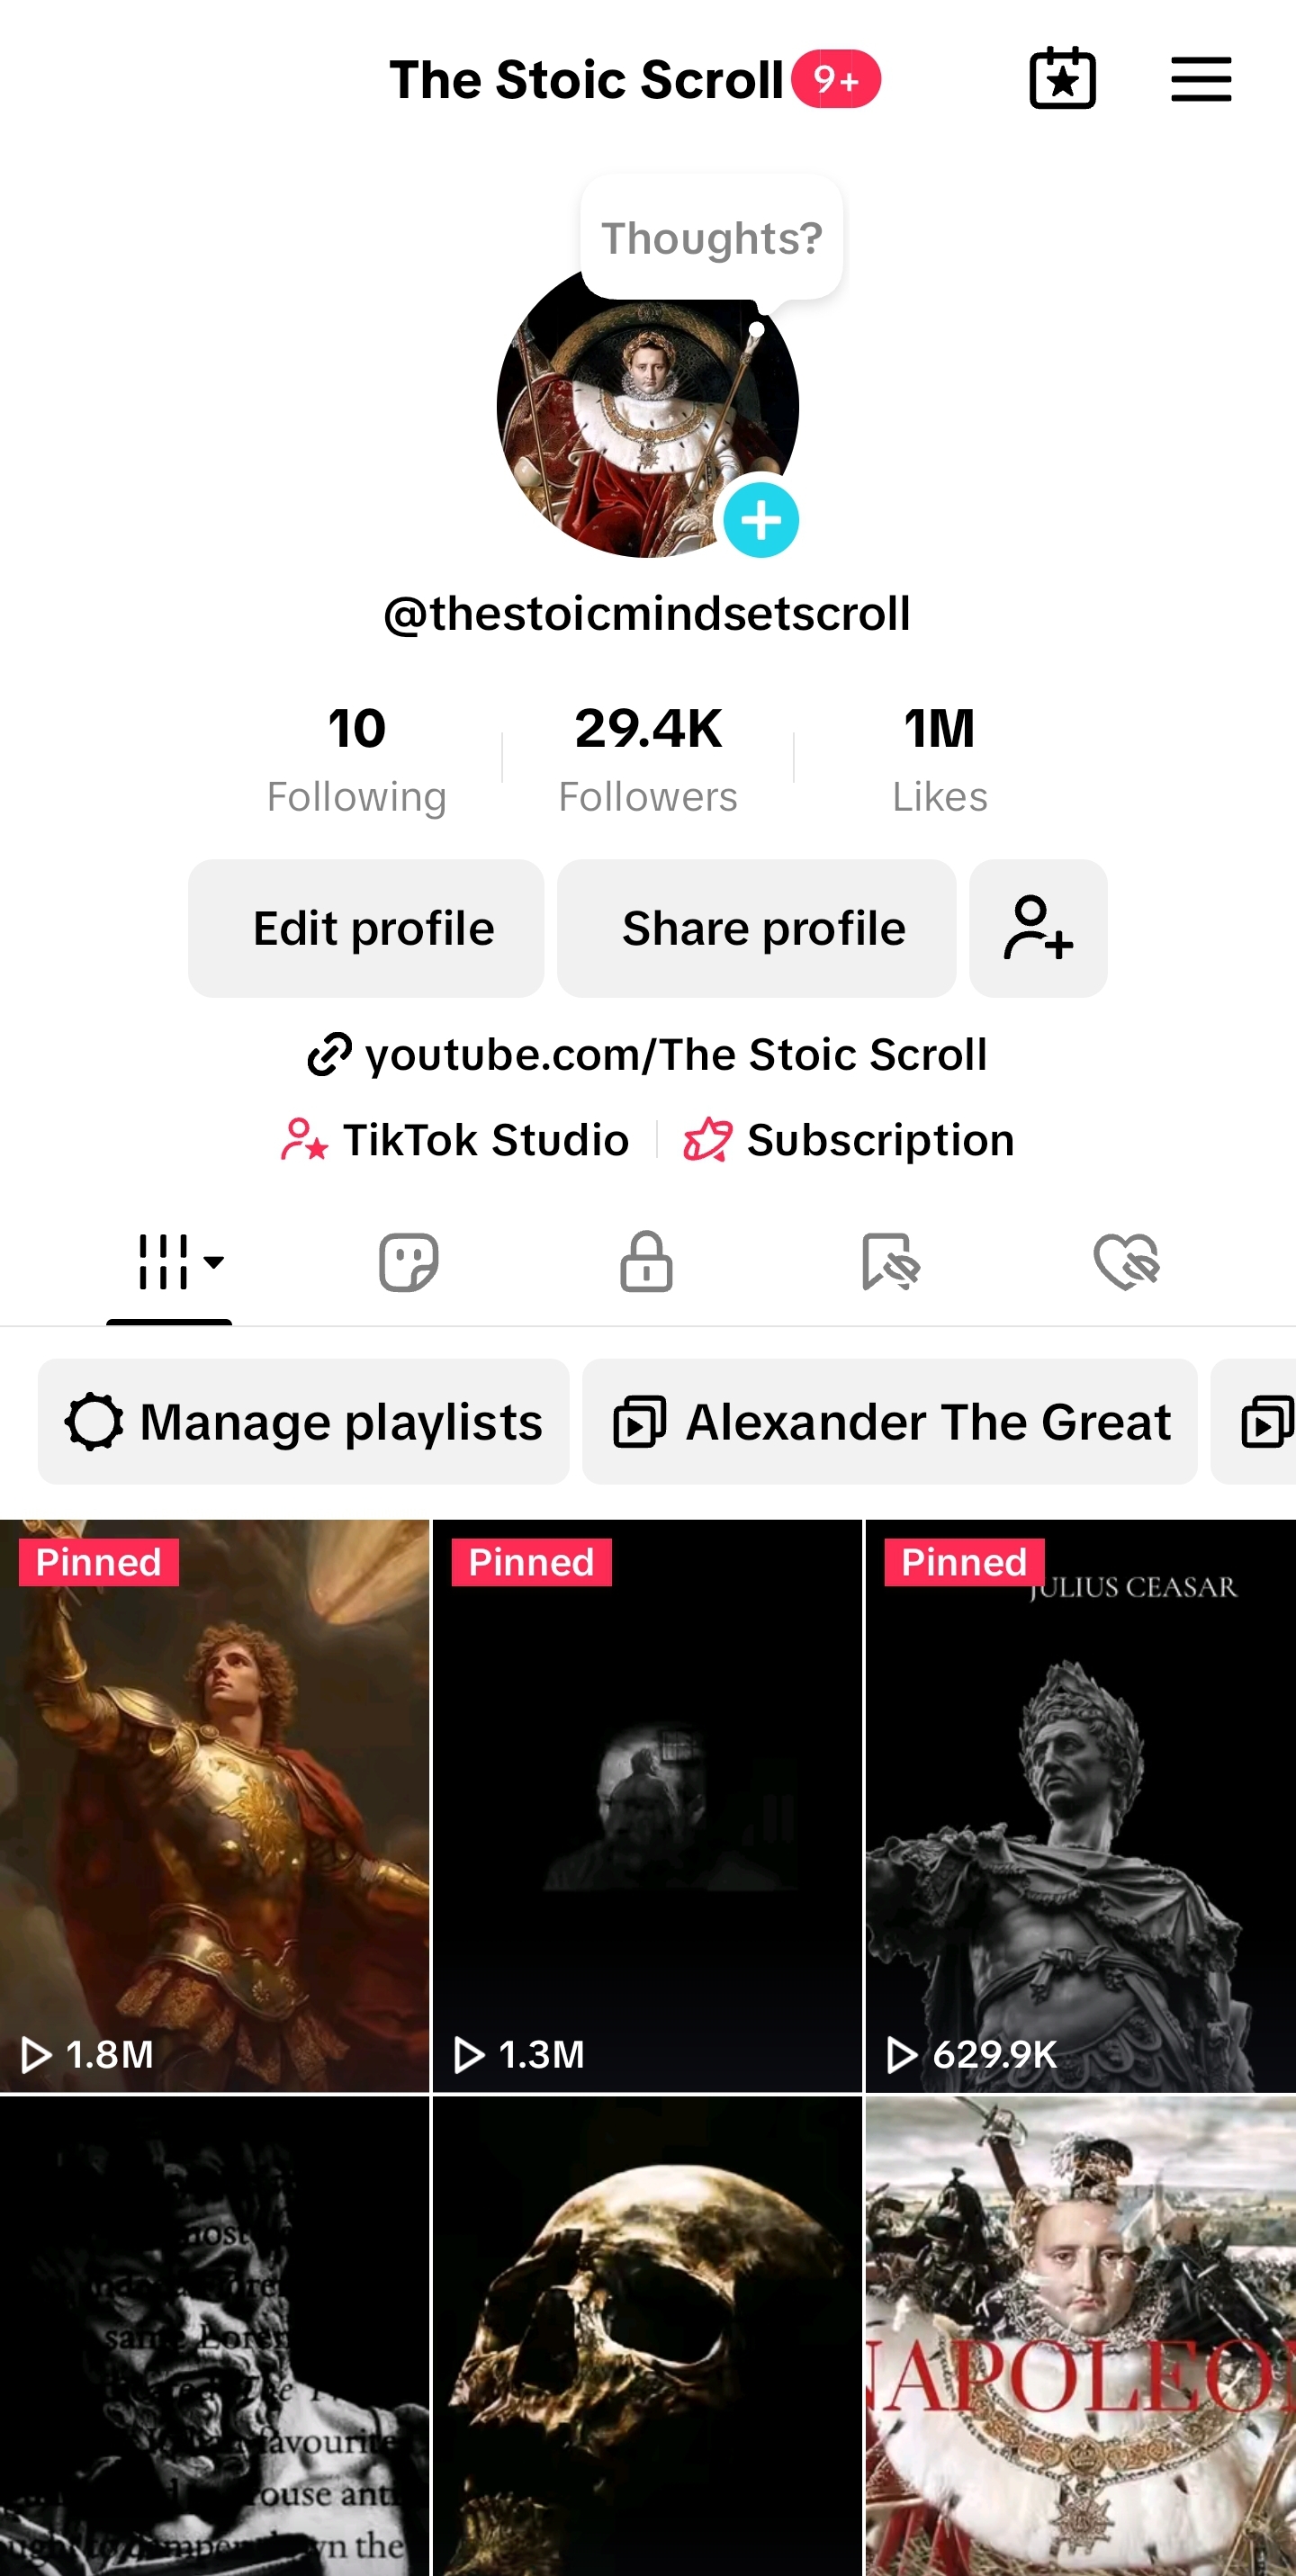 , opens full size in a new tab
The Stoic Scroll
14 Apr 2025: 29.4K followers, 1M likes. Today: 41.2K and 1.7M.
Both profiles on 14 April 2025, a week after the last post: 10.3K and 29.4K followers. They have roughly doubled since without me adding anything. Tap either for the full size.
What I took from it
Same idea, different opening, completely different result. Obvious written down. Very easy to ignore when you like what you made.
It also taught me to read the response as data instead of a verdict on me. That one took longer.
Who did what
I made and posted all of it.
If you do distribution seriously, I want to know how you pick what to test next. That's the part I did on instinct.